Live tracking
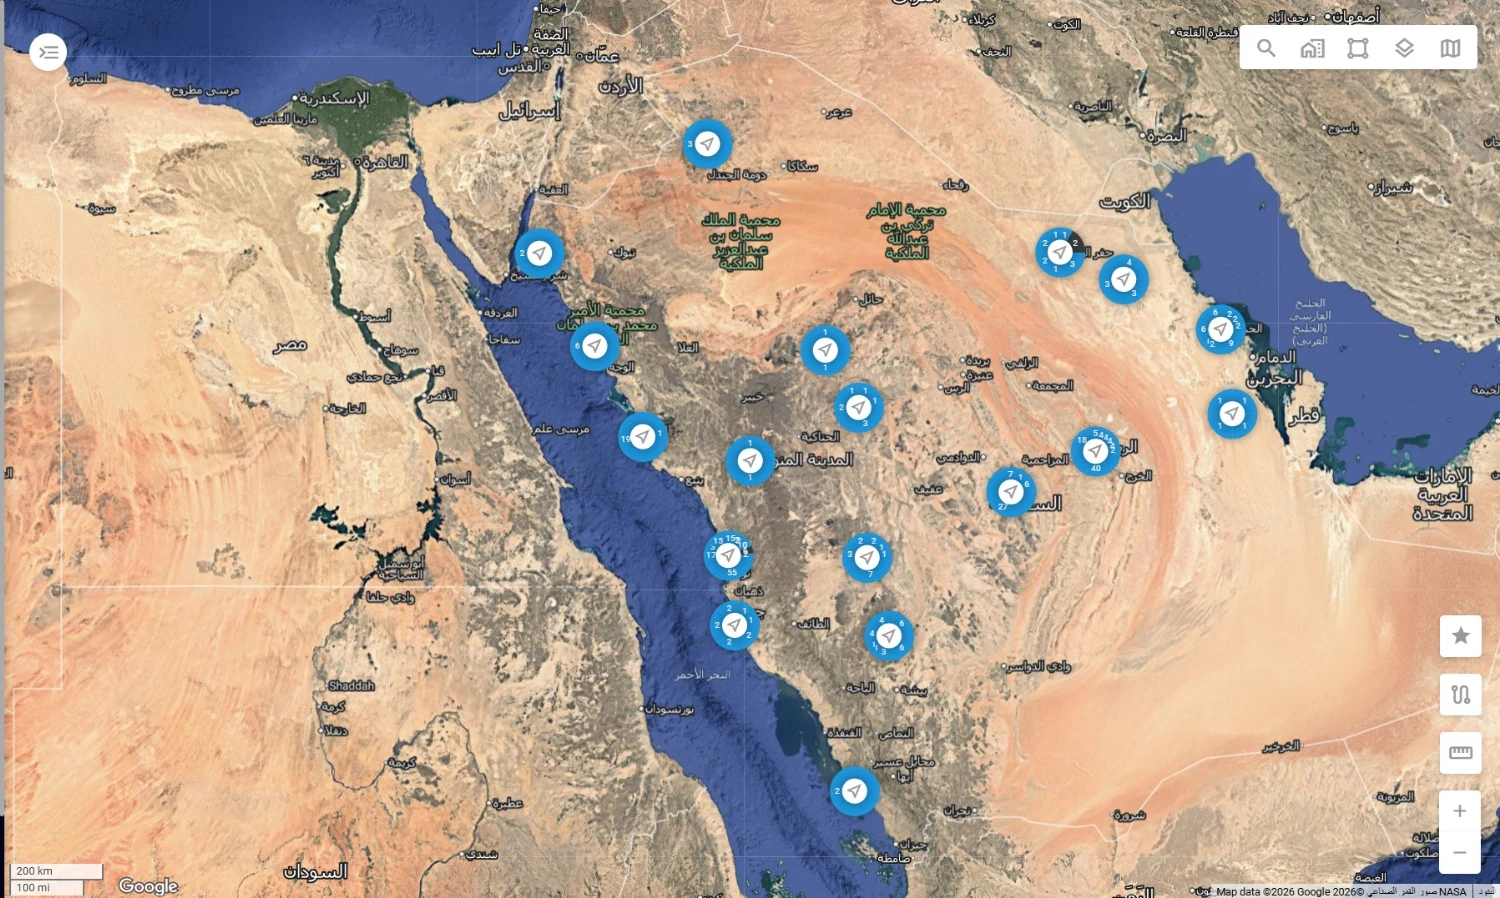
Every unit on one map: position, speed, heading, ignition. Cluster view for the fleet, street view for the vehicle.
Components
Ecosystem
Navixy, distributed in Saudi Arabia by Smart Tracks.
The whole platformPlatform
Navixy is the international telematics platform Smart Tracks distributes in Saudi Arabia. Whether your customers log into it under your brand or your own dispatchers use it directly, this page is what it does, in plain terms.
Components
What most people call “the tracking system” is three separate pieces of engineering. Knowing which one a customer is really asking about is most of the job.
Visibility for operations
Positions become trips, stops, exceptions and driver scores — the reports and monitoring rules a dispatcher works from all day.
Read moreNo-code data orchestration
Decode raw device frames, branch on conditions, fire actions and deliver the result to your own endpoint — assembled visually, not written.
Read moreTelematics data intelligence
A managed warehouse for telematics history, mapped to drivers and assets and queryable in SQL by your BI stack and models.
Read moreEcosystem
A platform is only as useful as the things it accepts. These are the connection points that decide whether a deal is possible.
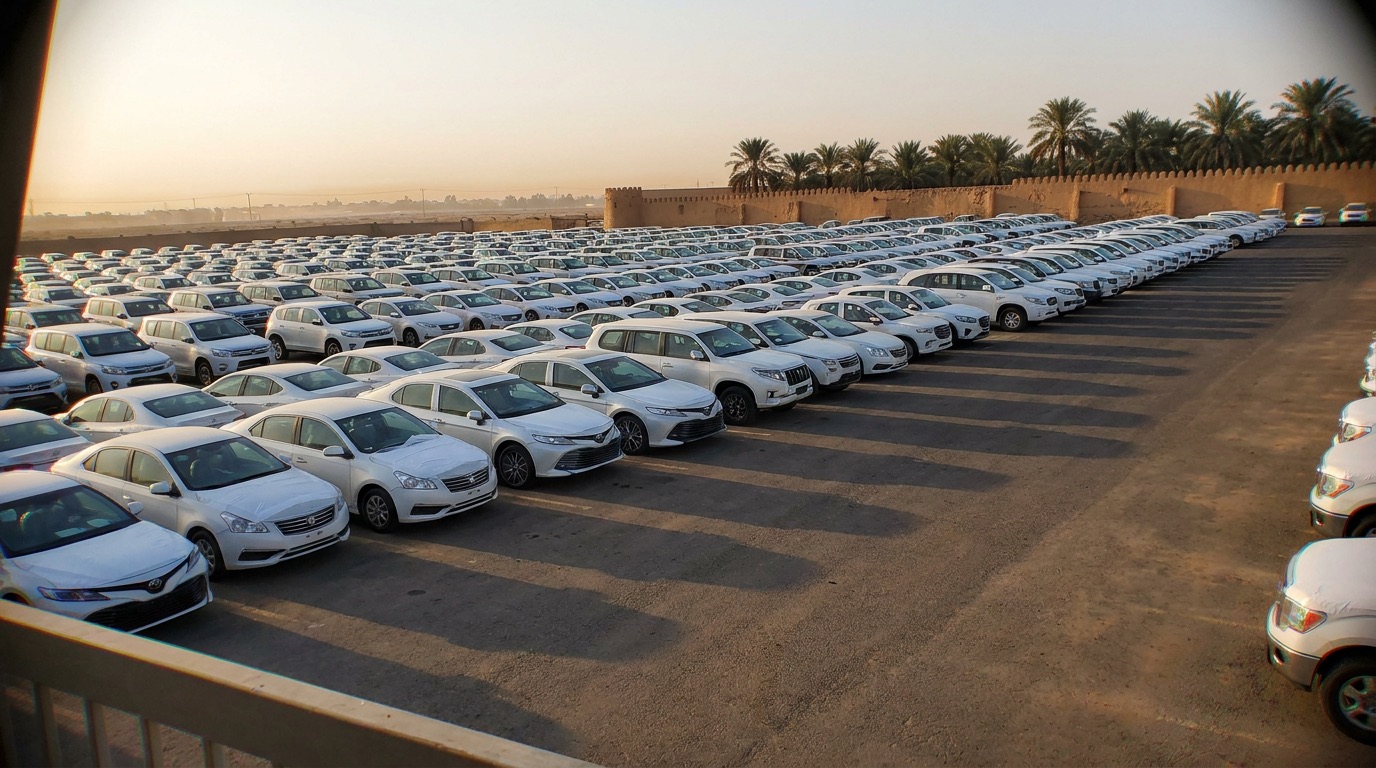
Data straight from the manufacturer's own connected-vehicle systems, unified in the same view as aftermarket units — for fleets that arrive already connected.
Read more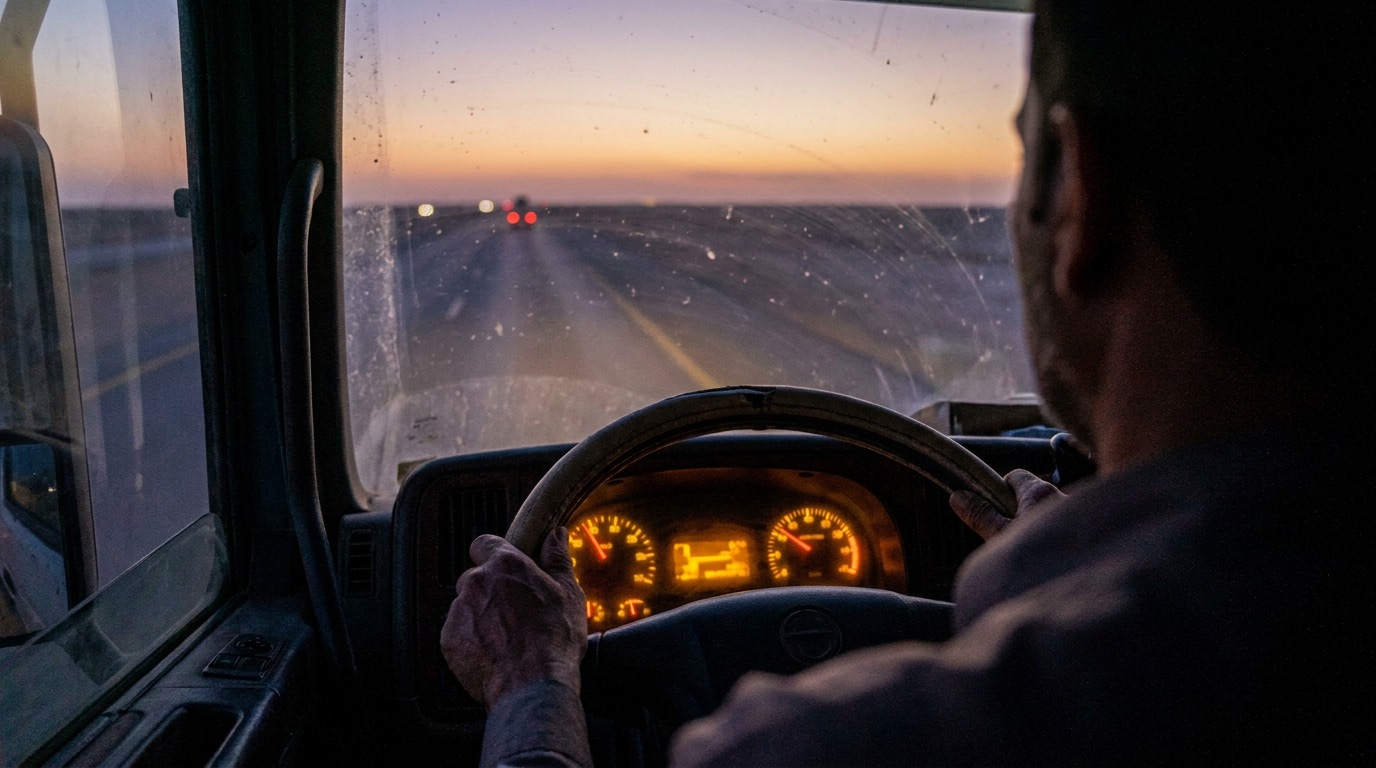
Road- and cabin-facing cameras and multi-channel recorders brought into the same platform as the tracking data, so an incident has footage attached to its position and time.
Read moreA documented Platform API and Admin Panel API, plus an SDK, so your developers build against the platform instead of around it.
Read moreThe platform is hardware-agnostic and supports a very wide range of trackers and sensors — your installed base is an asset you bring with you, not one you write off.
Read moreApplications and extensions built on the platform, available to add rather than commission.
Read moreModules
The components are the engineering. This is what it looks like on the screen, on a Tuesday.
Every unit on one map: position, speed, heading, ignition. Cluster view for the fleet, street view for the vehicle.
Any trip, any day, replayed second by second — stops, idling, speeds — and exportable when a dispute needs evidence.
Tank level from a calibrated sensor, charted against position. Fills, drains and drops flagged with time and place.
Harsh braking, acceleration, cornering and speeding, scored per driver — so coaching is aimed at names, not the whole yard.
Zones around yards, sites and routes. Entry, exit, after-hours movement and towing raise alerts to the right person.
Reefer temperature, door state, engine hours, CAN bus data — logged with the journey, not in a separate notebook.
Mileage, utilisation, fuel and stop reports, built once and delivered to inboxes on schedule.
Positions and events available to your ERP, dispatch or payroll systems over a documented API.
The interface
The interface below is the actual Navixy console — nothing here is an artist's impression. What you see in the demo is what your dispatchers use on day one.

The platform we distribute
Real Navixy screenshot composited here — supplied by client, never generated (§13)
Distributed locally
The software is proven across international fleets; the company contracting, invoicing, training and answering the phone is Smart Tracks in Saudi Arabia, with accredited partners in the field. That split is deliberate — it is the difference between a login and a working business.